AirCast Delhi

1 km Real-Time Weather Downscaling for India's Capital

Manmeet Singh, Saptarishi Dhanuka, Sandeep Juneja
Western Kentucky University  &  Ashoka University

Code 3D UNet + LCM Diffusion GraphCast Forcing
Scroll to explore

Global models can't see cities

State-of-the-art AI weather models like GraphCast produce forecasts at ~25 km resolution — enough to track synoptic weather systems, but far too coarse for urban decision-making.

Delhi NCT is just 1,484 km². At 25 km resolution, the entire megacity fits inside 3 grid cells.

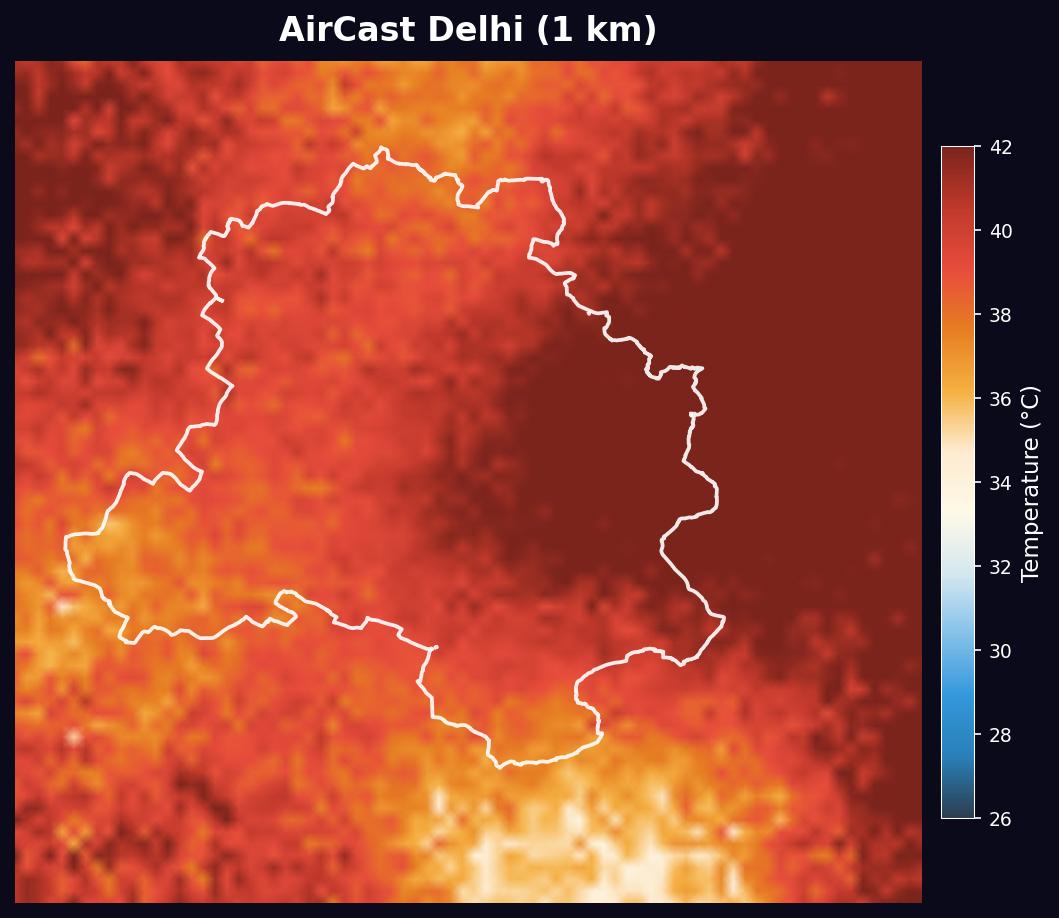
AirCast Delhi bridges this gap by downscaling GraphCast predictions to 1 km resolution using a 3D UNet with Latent Consistency Model (LCM) diffusion — revealing neighborhood-scale temperature gradients, urban heat islands, and local circulation patterns invisible to global models.
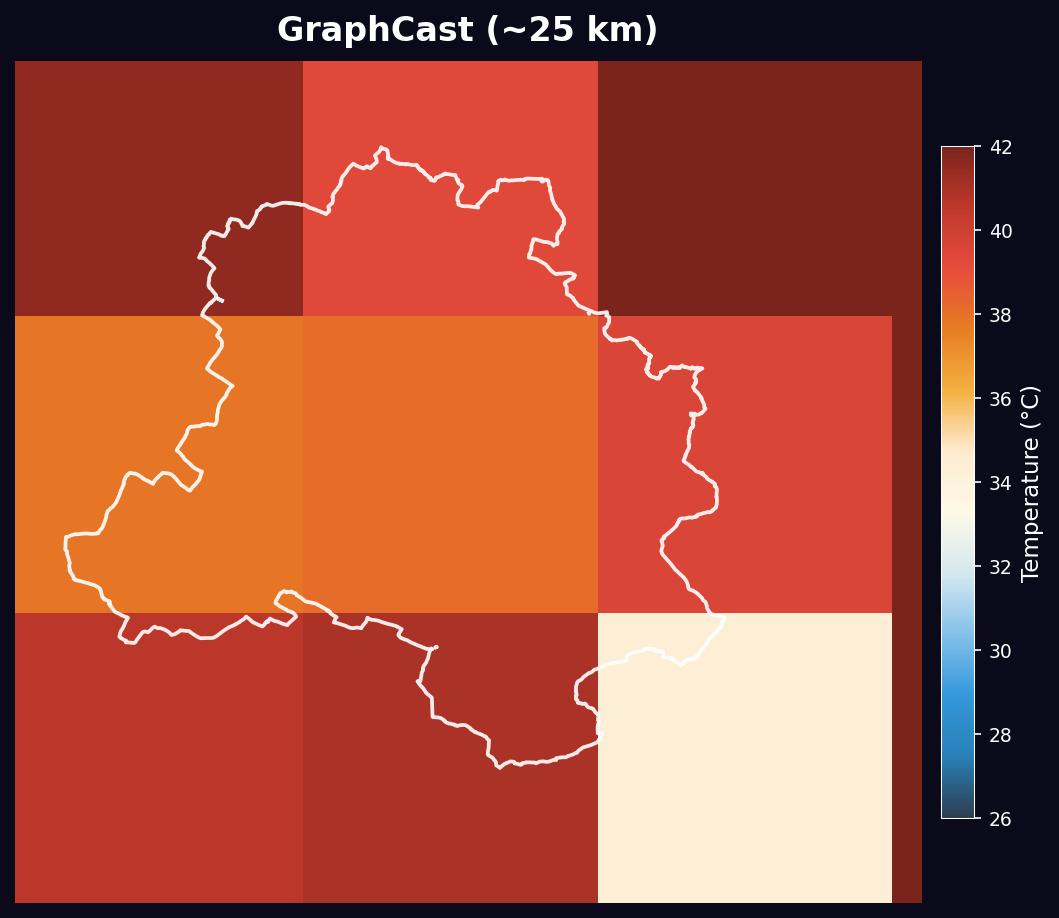
GraphCast 25km resolution
Input ~25 km
AirCast Delhi 1km resolution
Output 1 km

Three-stage downscaling pipeline

From global AI forecast to street-level weather intelligence in seconds.

🌐

GraphCast

Google DeepMind's global AI weather model provides 0.25° forcing fields

🧠

3D UNet + LCM

Latent Consistency Model diffusion, conditioned on topography and sky-view factor

🗺️

1 km Forecast

High-resolution grid at 0.01° spacing, 8 surface variables, hourly output

Model Architecture

GraphCast0.25° global
TopographySRTM 90m
Sky-View FactorSVF grid
3D UNetEncoder–Decoder
LCMConsistency distill
Spline Blend75% overlap tiles
1 km Output8 variables

24-hour temperature evolution over Delhi

Watch the diurnal heating cycle unfold at 1 km resolution. Forecast initialized 14 June 2026, 00Z.

Loading...

25× resolution enhancement

Drag the slider to compare GraphCast input (~25 km) with AirCast Delhi output (1 km) at peak afternoon heating.

GraphCast 25km AirCast Delhi 1km
◀ ▶
GraphCast ~25 km AirCast Delhi 1 km

Station-level forecast accuracy

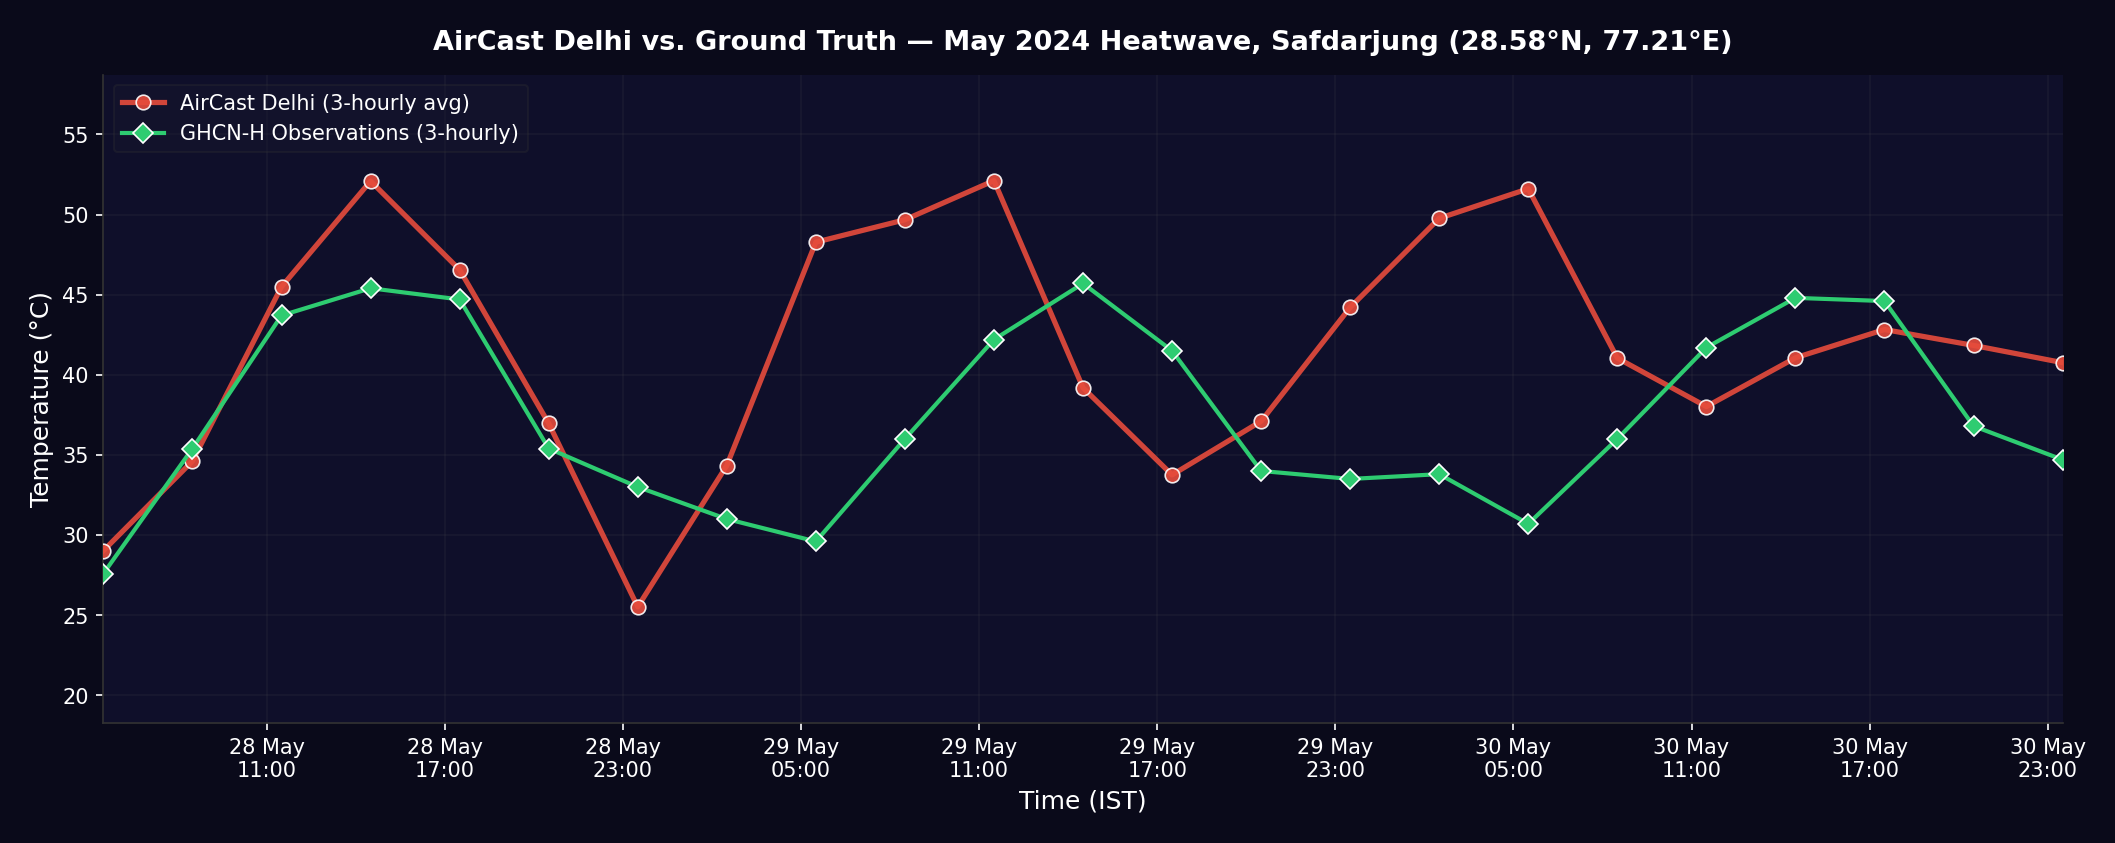
Hourly AirCast Delhi forecast (red line) compared against 3-hourly GHCN-H ground truth observations (green diamonds) at Safdarjung station during the May 2024 heatwave.

Temperature forecast timeseries at Safdarjung

Under the hood

1 km
Spatial Resolution
0.01° grid spacing (~1.1 km at 28°N)
72 × 78
Grid Dimensions
72 latitude × 78 longitude points covering Delhi NCT
8
Output Variables
T2M, U10M, V10M, PRATE, SLP, RH2M, PSFC, Q2M
LCM
Diffusion Model
Latent Consistency Model for fast, high-fidelity generation
75%
Tile Overlap
Hermite spline blending eliminates boundary artifacts
67 h
Forecast Horizon
~3-day lead time from GraphCast initialization